What's new: Introducing Function Insights
In the past weeks, we've put a lot of effort into improving the reliability and capabilities of our Scheduler and Build Pipeline.
Some of our customers, executing thousands of executions from dozens of background functions, told us that the Defer Dashboard was hard to navigate.
With the release of the Environment screen, we are happy to announce that the Defer Dashboard is now providing a better overview of your functions and executions:
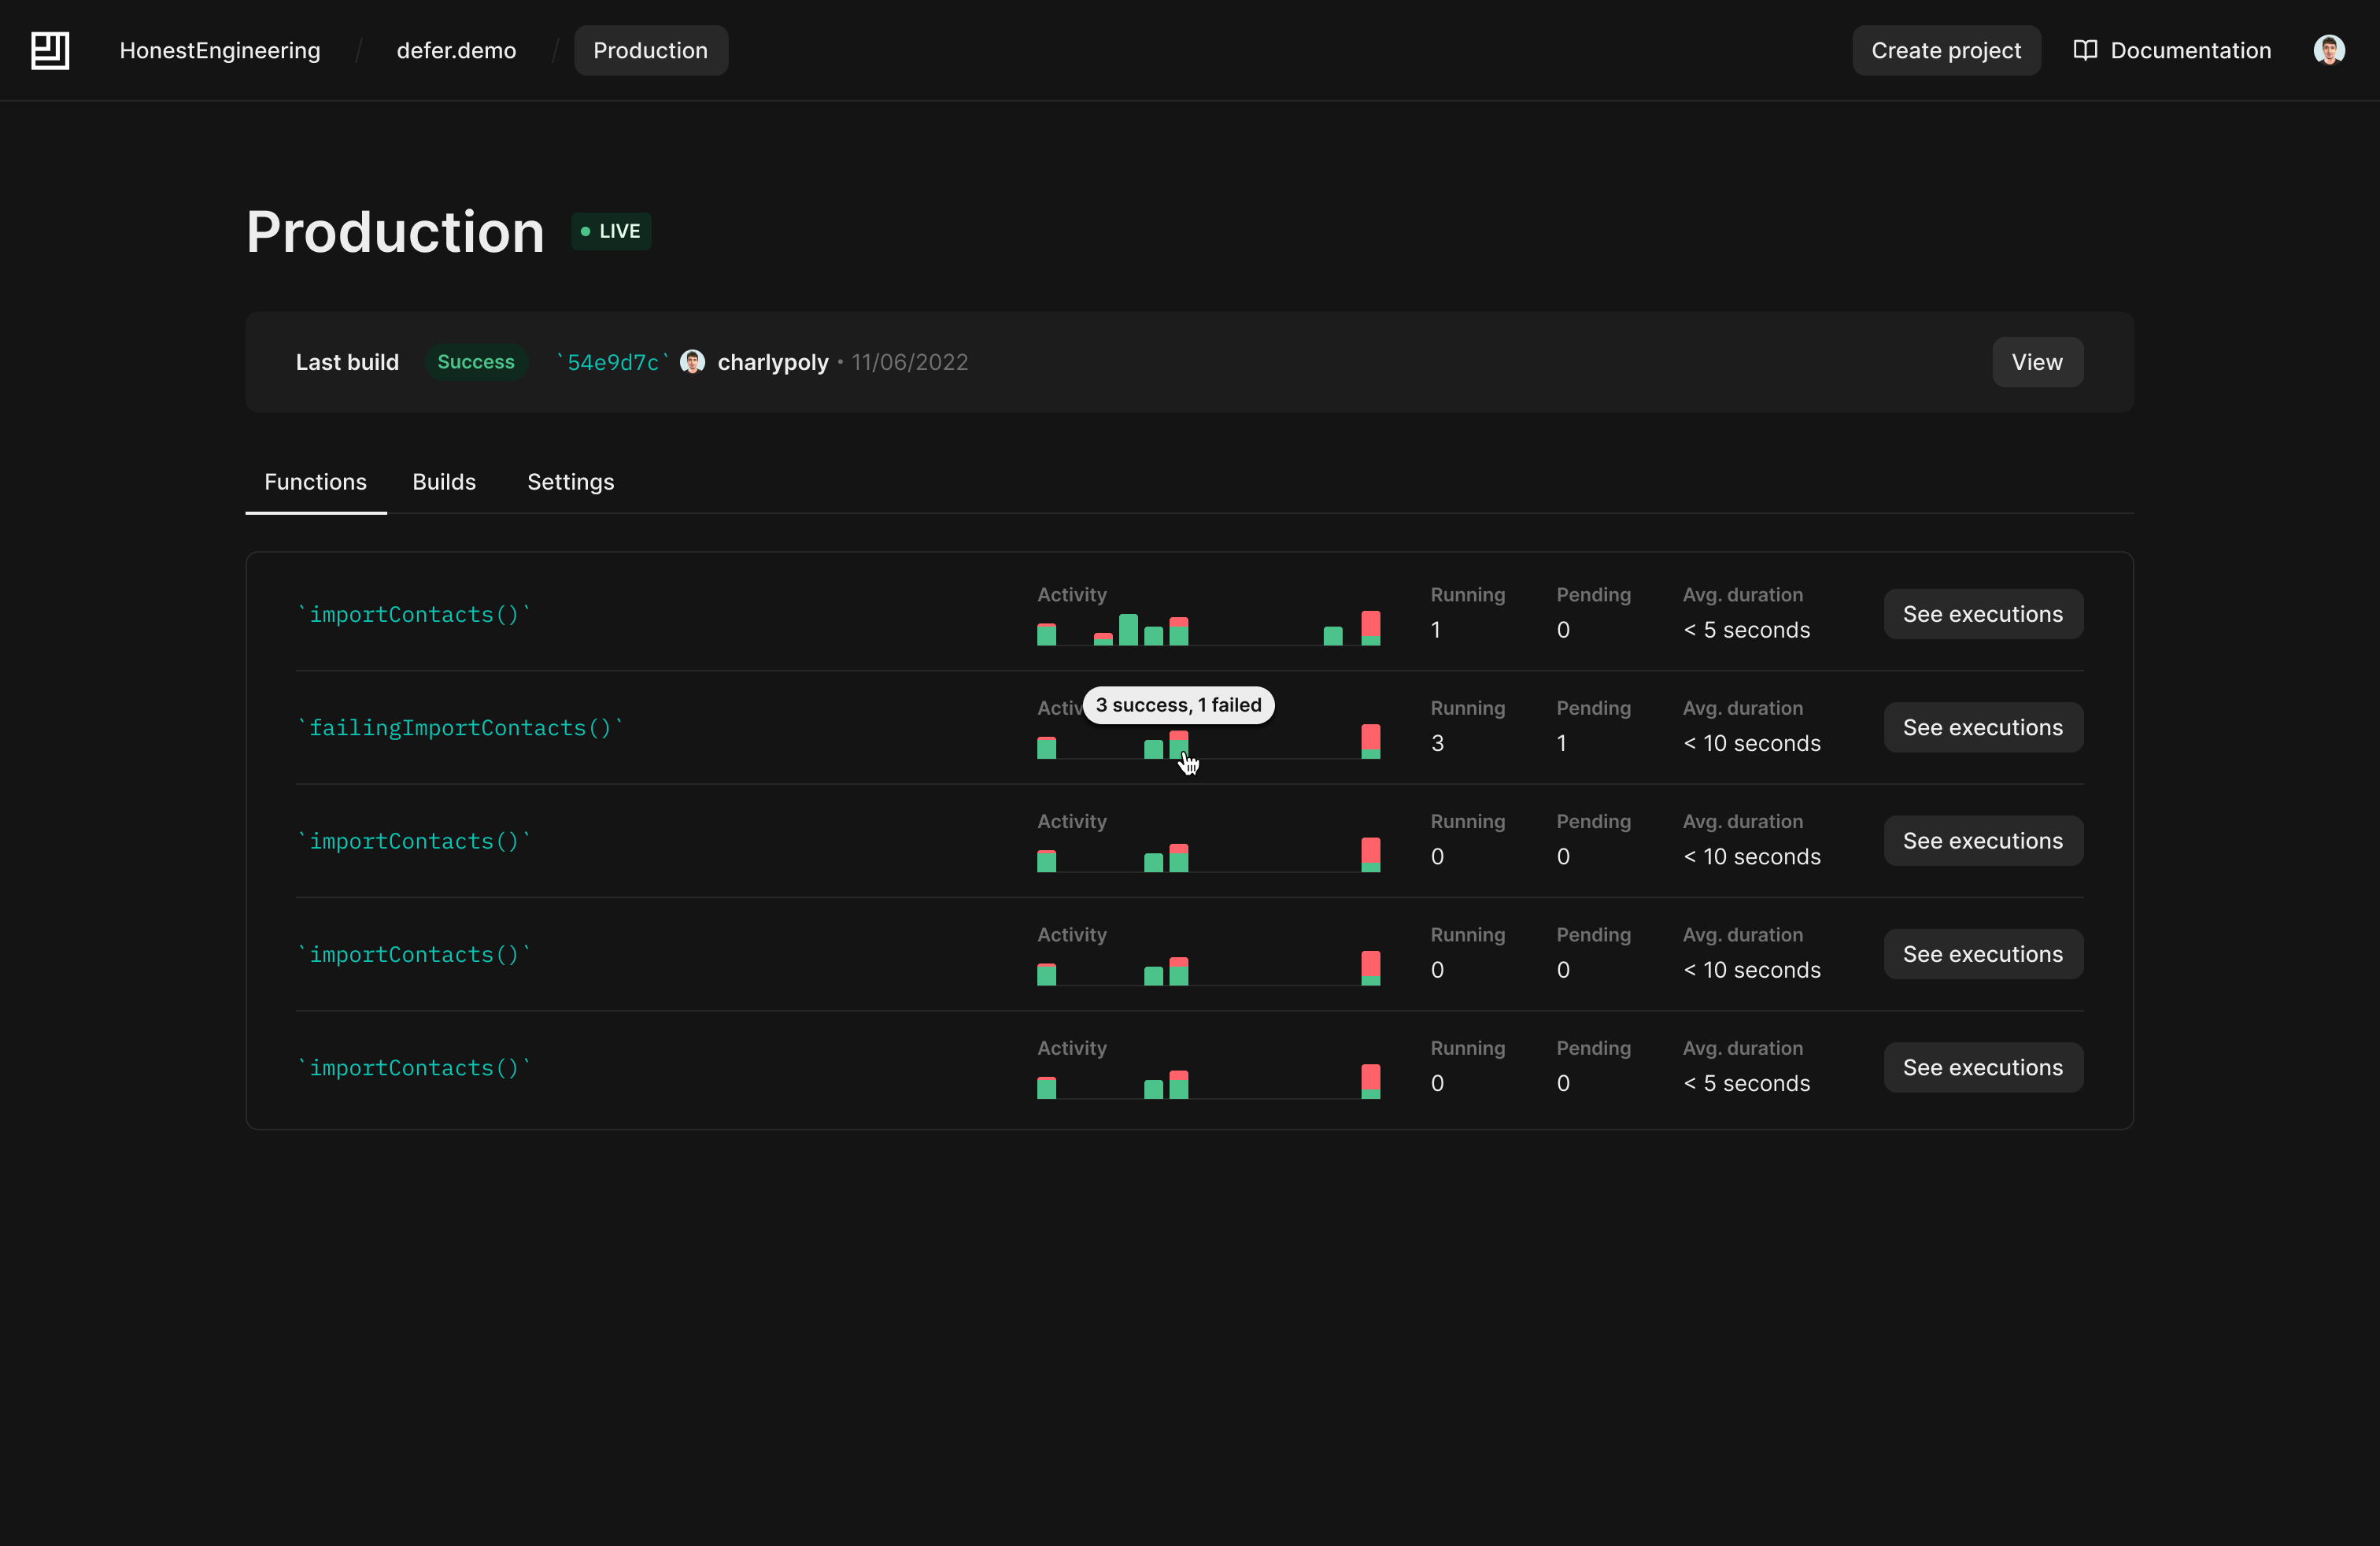
By navigating to one of your application's environment, you get immediate access, in real time, to:
- The build status of your environment
- The overall health, status, and performance of your background functions
Coupled with Slack notifications, the Defer Dashboard is now your best tool to check and narrow down potential issues in your application.
More improvements will soon land on the Defer Dashboard with a revamp of the Executions list and Execution view!
Related articles
Scheduling features are now available locally
Most of Defer Scheduler's features are now available locally for a smoother experience.
Advanced Scheduling with the Defer public API v2
Our Scheduler is now directly accessible for advanced use cases such as building a configurable notifications system, create batches of executions or user configurable worflows.